![[LIFT] architects](/storage/layout/Header_025.png)
Entries in Architecture (23)
Printing Material Distributions
 AOP
in 3D Printing, Architecture, Objet, Research
|
AOP
in 3D Printing, Architecture, Objet, Research
|
 Post a Comment
|
Post a Comment
|
 1 Reference
written by: Panagiotis Michalatos and Andrew Payne
Most digital design involves surface modeling. Even so called “solid” modeling software is based on representations where a “solid” is that which is enclosed by a set of boundaries (known as boundary representations or ‘Brep’ for short). While digital representations of solid objects are often treated as homogeneous and discrete entities, the reality is somewhat different. In the real world, material distributions are continuous and varied. Yet, with regard to architectural components, the variability of material within a volume is usually concealed (ie. porosity of bricks, various types of reinforcements for concrete structures, etc.) and is rarely taken into account during the early design process. With the advent of 3d printing techniques, a new possibility emerges - allowing us the ability to reconsider the aesthetic and mechanical properties of visible reinforcement. In this post we discuss a structural optimization method in conjunction with the possibility of treating structural elements as living in a material continuum that renders objects and reinforcements fuzzy.
Topology optimization is a form finding technique which seeks to optimize a certain material distribution with given boundary conditions (ie. types of supports and loads). It departs from standard form finding techniques in that it assumes that a volume of virtual material can continuously vary its stiffness or density throughout space. Until now the final step of this process involved a cut off threshold; a sharp boundary of hard solid material and void. However intermediate steps of topology optimization suggest grey zones of intermediate material stiffness. These results were usually discarded as unrealistic from a fabrication point of view. With multi material printing we can experiment and speculate about possible realizations of such fuzzy structural objects. The analysis and design of the experiments presented here were carried out using the tools Topostruct (a standalone application) and Millipede (a plugin for Grasshopper) created by Panagiotis Michalatos and Sawako Kaijima.
Three experiments were conducted: the first is the design of a chair using standard topology optimization techniques and interpretation (single solid material), the second was a new type of truss/beam element with fuzzy visible reinforcement (soft transparent material encasing gradations of a harder bone-like structure), and the last one was a similar interpretation to the cantilevering slab which produces patterns reminiscent of a leaf (since leaves solve the same structural problem).
Example 1: A chair
The chair example uses topology optimization to gradually remove material from a solid volume on which the actions of a person seating are applied (ie. vertical and horizontal loads for the seating position). 3d printing allows us the ability to materialize the intricate structures that emerge especially around moment connections.
;)
Figure 1: from left to right: Initial boundary volume setup for chair configuration and successive steps of material redistribution through topology optimization. Darker areas designate denser material.
;)
Figure 2: Features of the chair become more refined during each subsequent step through the topology optimization process.
;)
;)
Figures 3 & 4: Converged geometry of the topology optimization process.
Example 2: A fuzzy truss
For the second experiment we revisited one of the simplest forms from engineering textbooks. The truss like structures that act like bridges supporting a distributed load at their two end points. However, in this example, the topology optimization routine was set up in such a way that instead of a solid object, it yielded a continuous variation of material stiffness. Using Objet’s multi-material printing technology, we were able to develop a gradated structure using a transparent rubbery material and a hard white material (and the gradations in between the two) to achieve an outcome that looks, feels, and structurally acts like a fuzzy reinforced structure.
;)
Figure 5: [top left]: Setup of boundary conditions for simple bridge [main volume + supports at the two lower corners and distributed load at the top]. [top right]: Deflected shape of solid material after load application. [bottom images]: stress distribution and topology optimization contours. Inner contours represent regions where stronger material is required.
;)
Figure 6: Topology optimization drives material redistribution within the volume of the truss. A fuzzy truss shaped beam reinforcement gradually emerges.
;)
Figure 7: A 3d printed diagram showing the distributed load on top and the two supports on either end plus the optimal shape of the reinforced region.
;)
Figure 8: Using multi-material printing technology, a fuzzy bone-like structure can be created using gradients between a transparent rubbery material and an opaque hard material. In this way the actual outcome of the topology optimization process can be directly materialized.
Example 3: A leaf-slab
Our final experiment involved the reinterpretation of a different traditional system - the cantilevering slab. The distributed load over this horizontal plate puts similar requirement to that of a leaf and topology optimization yields branching structures reminiscent of the venation found in leaves.
;)
Figure 9: A fuzzy branching pattern emerges when a distributed load is applied to a cantilevering slab from a single support, resembling the vein patterns of leaves.
;)
Figure 10: A 3d printed diagram showing the cantilevered load and support structure.
;)
Figure 11: Multi-material printing allows us to materialize semi-rigid and semi-transparent fuzzy structural systems as a kind of gradual reinforcement embedded in the material where the boundaries between softer and harder parts are blurred.
The ability to continuously vary the stiffness and transparency of material will allow us to rethink design techniques and technologies, software tools, and analysis methods beyond the surface modeling paradigm. In the scale of product design this is already possible thanks to technologies like multi-material 3d printing. Such experiments will be valuable precedents when speculating about new types of continuous and fuzzy building systems.
This research was generously supported by Objet Technologies. For more information about their 3d printing technology, visit http://www.objet.com.
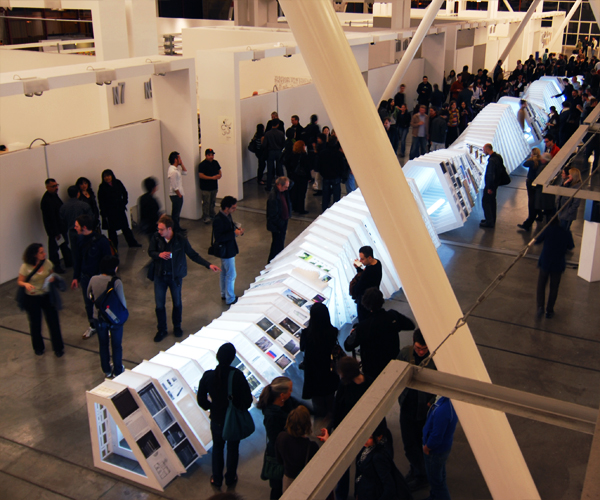
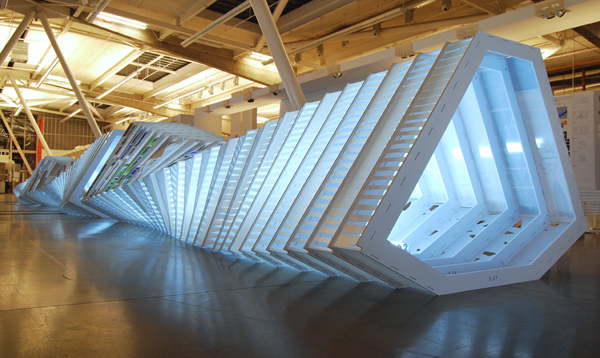
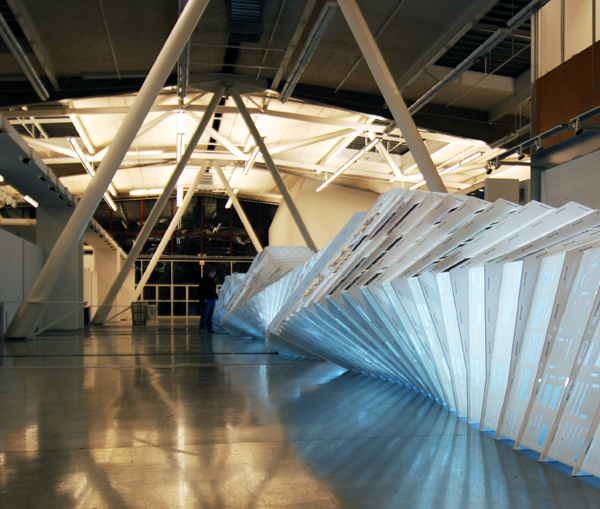
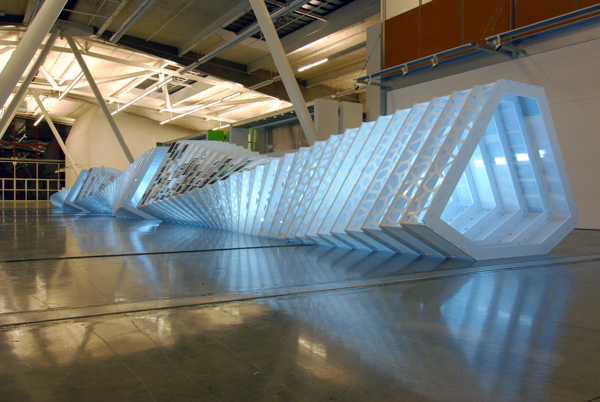
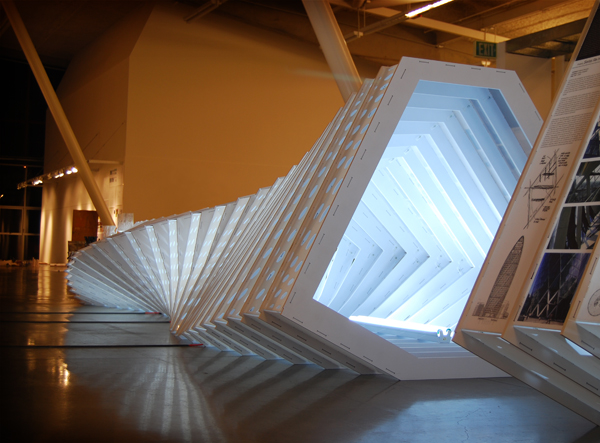
FLUX Opening Night
The FLUX exhibition opened last night at the California College of Arts and we had an incredible turnout. The exhibition explores contemporary architecture and design through its relationship with changes in design technologies such as parametric modeling, digital fabrication, and scripting. Over 40 projects are featured in the exhibition through drawings, photographs, and specially made models that explore the techniques and processes presented in the projects. Eight topics dealing with the geometric and performative aspects of the projects are explored: Stacked Aggregates, Modular Assemblages, Pixelated Fields, Cellular Clusters, Serial Iterations, Woven Meshes, Material Systems, Emergent Environments. I was brought in as a parametric modeling and complex geometry consultant to write a Grasshopper definition that would generate the form, ribs, plexi-glass panels, and all of the connection details. These would in turn be flattened in Rhino so they could be sent directly to the CNC mill. Final fabrication started just 2 weeks before the opening and because all of the details had been controlled in the parametric model, each of the 4 modules could be constructed in just two and half hours.
Director of Architecture, CCA: Ila Berman
Project Design and Fabrication: Kory Bieg, Andre Caradec, Andrew Kudless
Parametric Design Consultant: Andy Payne
Sponsors: K Bieg Design, Studio Under Manufacture, Solid Thinking
Photos courtesy of Kory Bieg
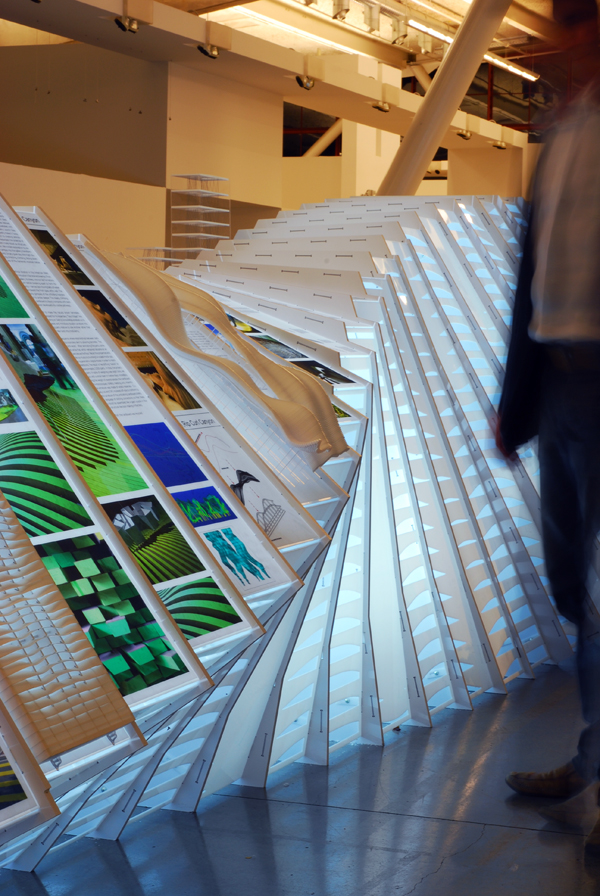
FLUX Fabrication
Below are some of the in-progress shots for the FLUX Exhibition which will open on March 30th at 8:30pm at the San Francisco campus of the California College of the Arts. The school is located at 1111 Eighth Street, San Francisco, CA.
Director of Architecture, CCA: Ila Berman
Project Design and Fabrication: Kory Bieg, Andre Caradec, Andrew Kudless
Parametric Design Consultant: Andy Payne
Sponsors: K Bieg Design, Studio Under Manufacture, Solid Thinking
Photos courtesy of Kory Bieg


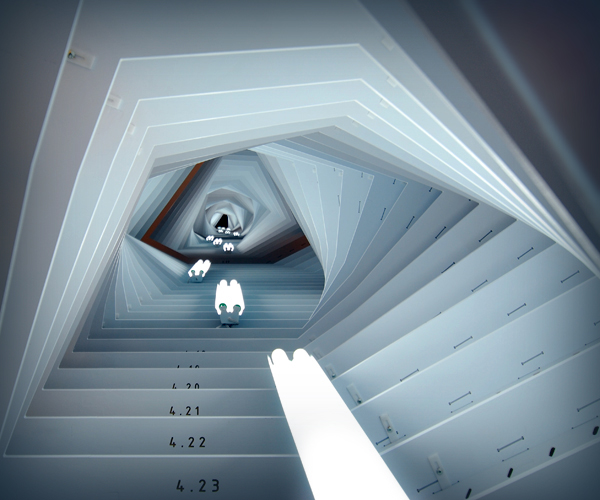
FLUX Parametrics
The following are a series of diagrams that help explain the parametric process I used for the FLUX Exhibition which opens in San Francisco on Monday, March 30th. The entire project was completed using the Grasshopper plugin for Rhino and was used to create all of the flattened information - such as the rib outlines, the plexiglass panels, and all corresponding connection details - which was then sent directly to the CNC mill for fabrication. STEP 1: A series of points, pre-definied in three dimensional space, are referenced into the parametric software. The points can be controlled by a set of sliders that allow translation along any of the orthographic axes, ultimately driving the shape of each interpolated curve that passes through the control points.
  STEP 2: A set of planes are created at 10½” O.C. along the full length of the curve network. The distance between each plane, which controls the spacing between each rib, can be updated by changing a numeric slider.
  STEP 3: Because some of the interpolated lines in the curve network do not run the full length of the nave, but instead branch off of the two main lines, the topology of the curves would yeild an unloftable surface. However, the software can solve the intersection between a plane and a curve which results in a point. A line can be created between each new intersection point to form the outlines of each rib.
 STEP 4: The outside rib curves are offset 4” to create the inside of each rib curve. The ribs are then split into four modules for easier installation.
 STEP 5: Each rib set is then re-oriented to the XY plane to facilitate the CNC milling process.
 STEP 6: Once the rib curves have been flattened, the outlines can be offset and subdivided to create a series of notches in the ribs and the corresponding tabs on each side of the plexiglass panels. The software evaluates the length of each piece of plexiglass and determines the number of subdivisions on each side, so that longer panels have more tabs and thus more support than smaller pieces.
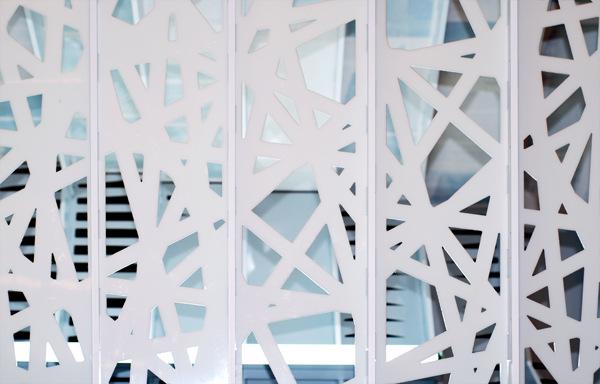
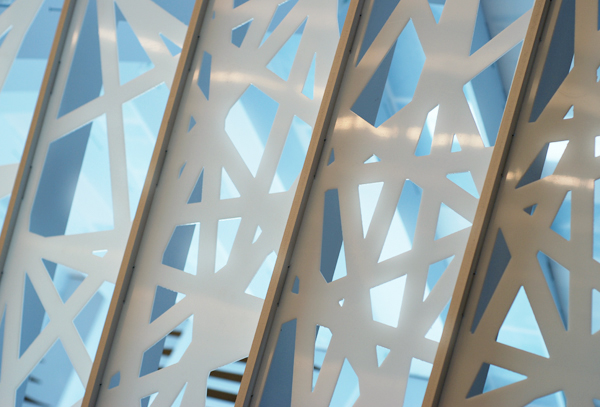
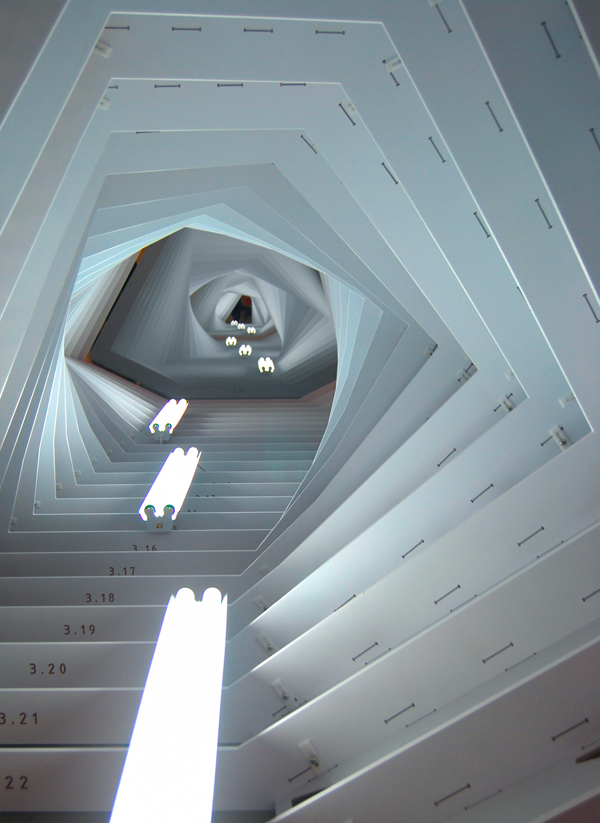
 STEP 7: A detail view of a flattened rib and the corresponding pleixglass panels. The perforations that occur in some of the panels are created in Rhinoscript and are coordinated with one of the eight architectural topics represented in the exhibition.
 A screenshot of the final definition used to create the entire FLUX exhibition. Click to enlarge.
Waffle Structural System: Using Grasshopper to Output Structural Ribs to a Laser Cutter or CNC Mill
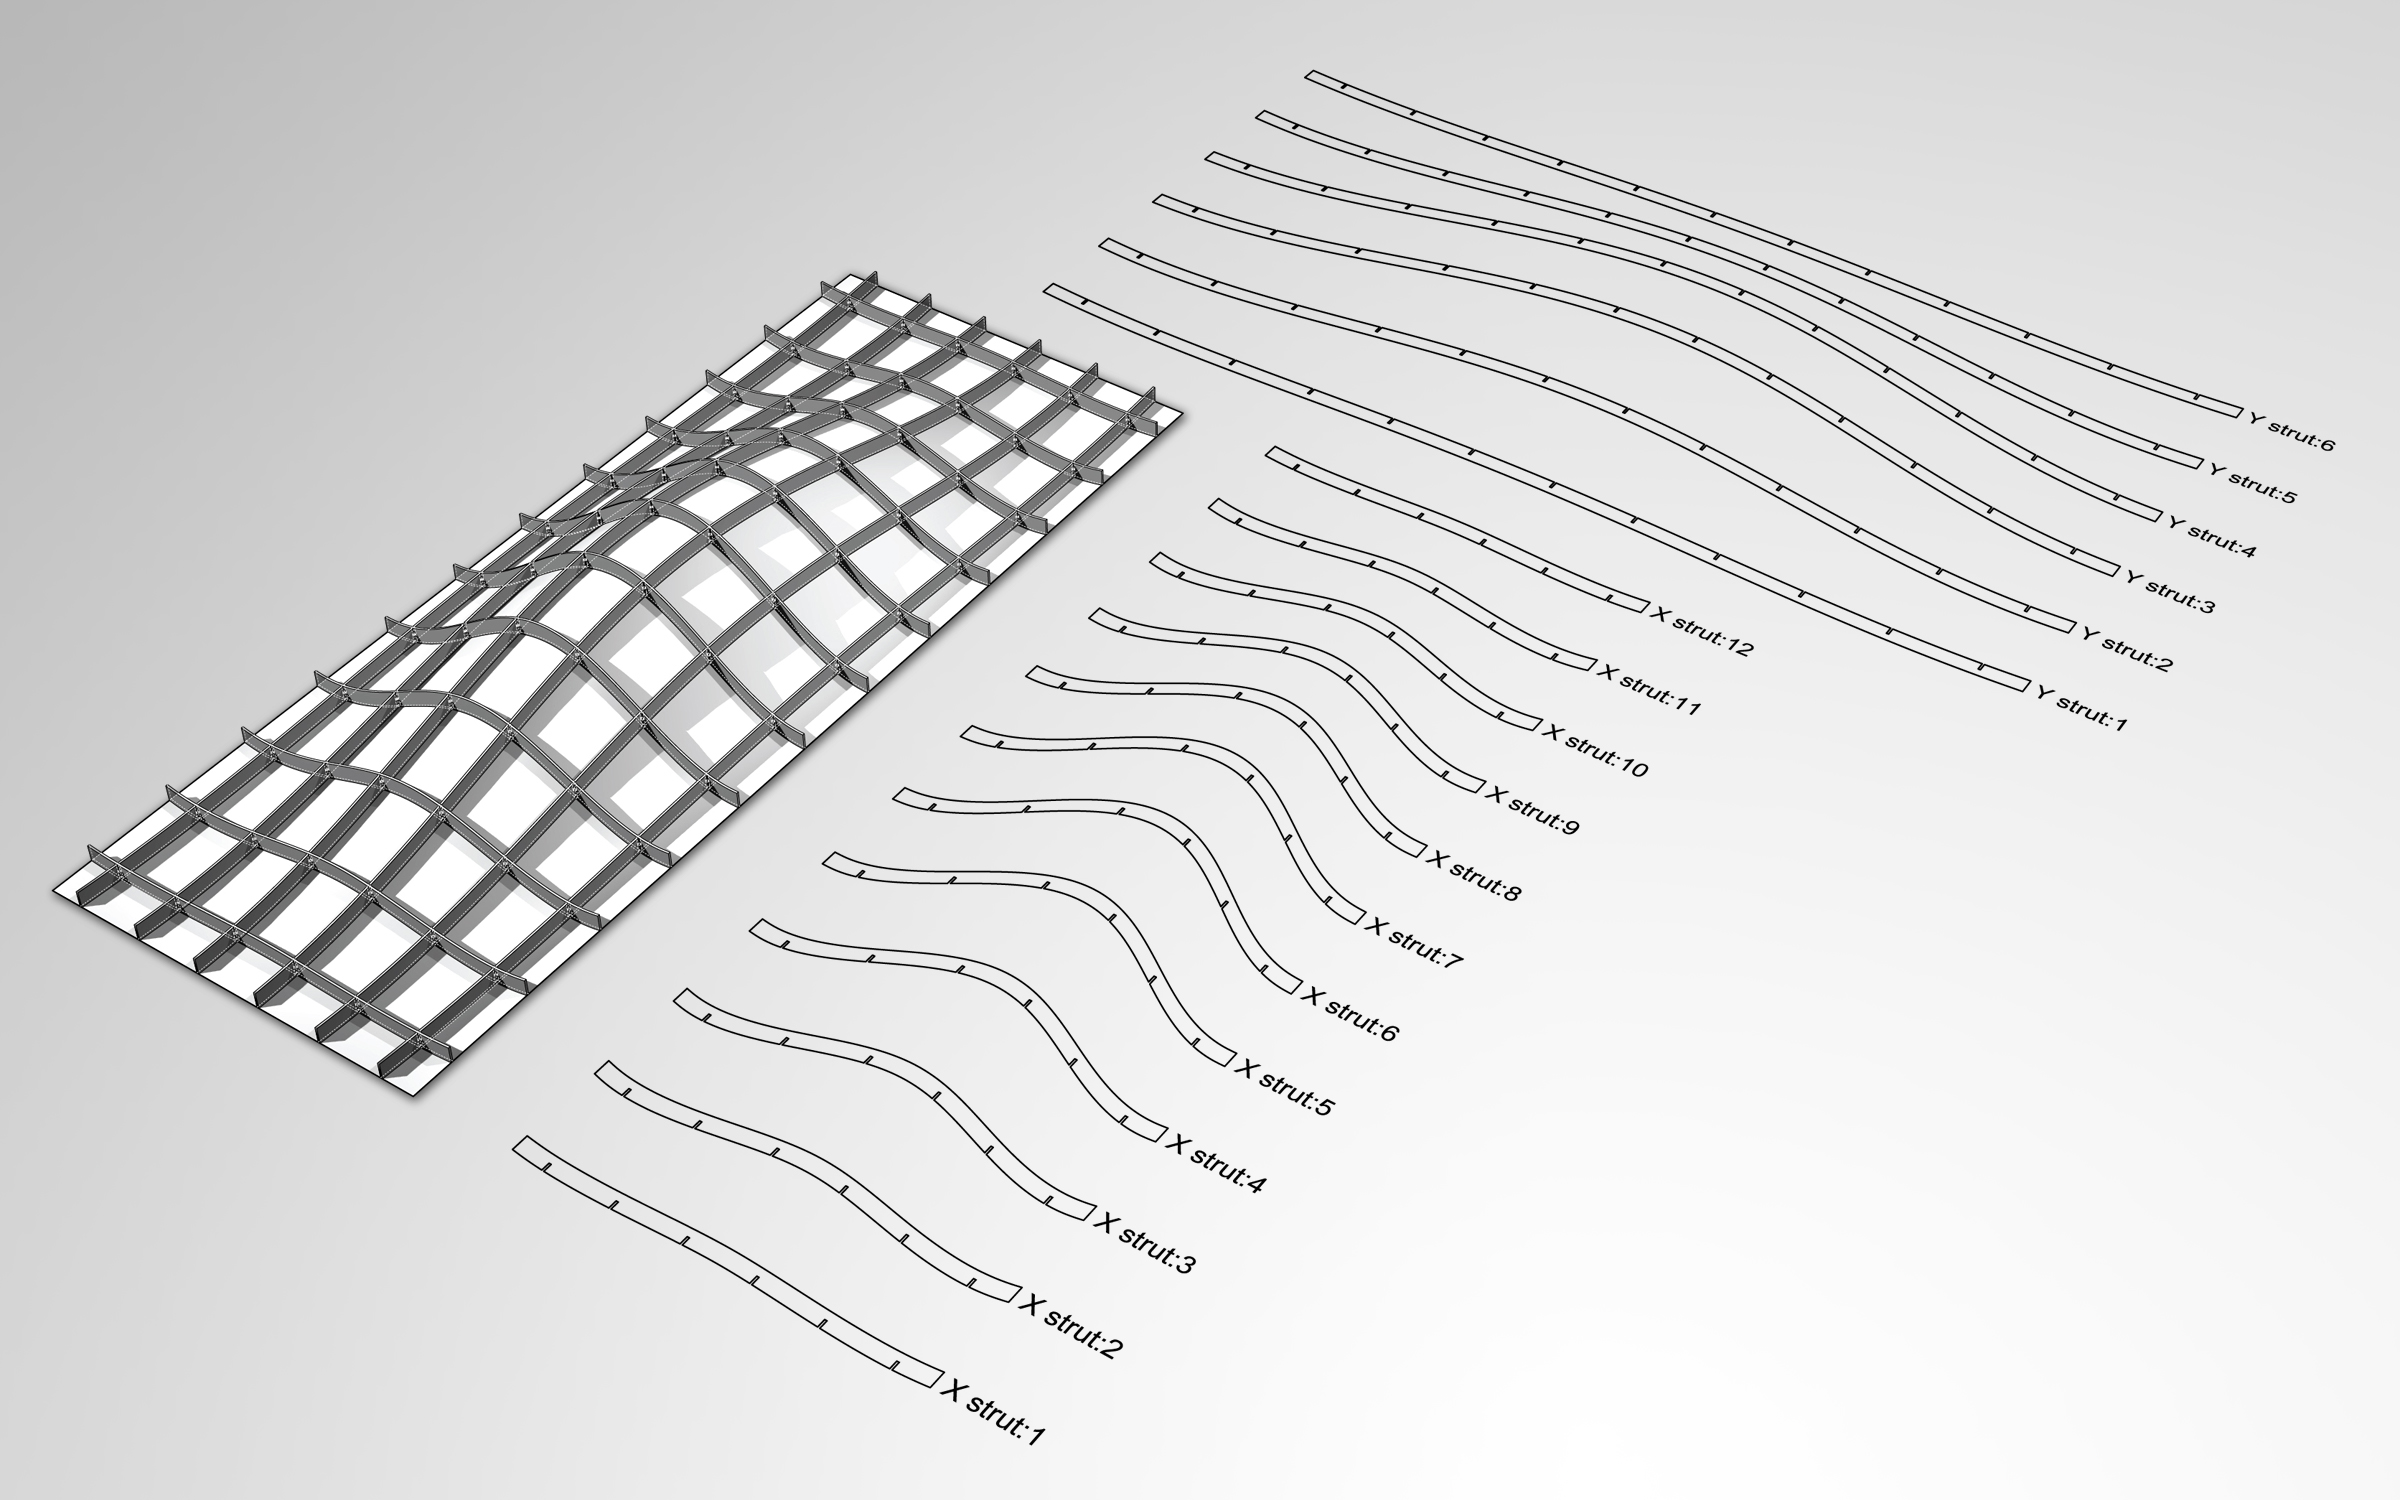 Click to see larger imageI have been working on a definition for Rhino's Grasshopper plugin that would create a notched "waffle" structural system for any given surface. With this definition, you can specify the number of struts in the X & Y axis as well as the strut depth and the notch thickness (or the strut material thickness). The waffle system has a few components that define the strut labels and has a slider to control the label size to keep the model organized. Finally, the definition orients the strut curves to the X-Y axis so that the curves can be easily output directly to a CNC mill or laser cutter.
Also, if you are able to use this definition to create a waffle structure of your own (either laser cut or CNC milled), please email me some images and I will post the work on this website. Good luck.
Source File:
Waffle_Structural_System.gh (size: 25k - file updated by GH user msieurju on 11.05.11 to work with Grasshopper v0.8.0052 or higher. I'd like to express my thanks for the udpate.)
Note: This software and its documents are in the public domain and are furnished "as is". The author, Andrew Payne, makes no warranty, expressed or implied, as to the usefulness of the software and documentation for any purpose. This work is licensed under a Creative Commons Attribution-Share Alike 3.0 United States License. http://creativecommons.org/licenses/by-sa/3.0/us/
Slow Food Nation Opening Night
Opening night at the Slow Food Nation event in San Francisco, CA


Slow Food Nation Install Day 3
Installation Day #3 of the Pickles Pavilion for the Slow Food Nation event in San Francisco, CA.

Slow Food Nation Install Day 2
Installation Day #2 for the Pickles Pavilion for the Slow Food Nation event in San Francisco, CA.


Slow Food Nation Install Day 1
Installation Day #1 for the Pickles Pavilion for the Slow Food Nation event in San Francisco, CA.


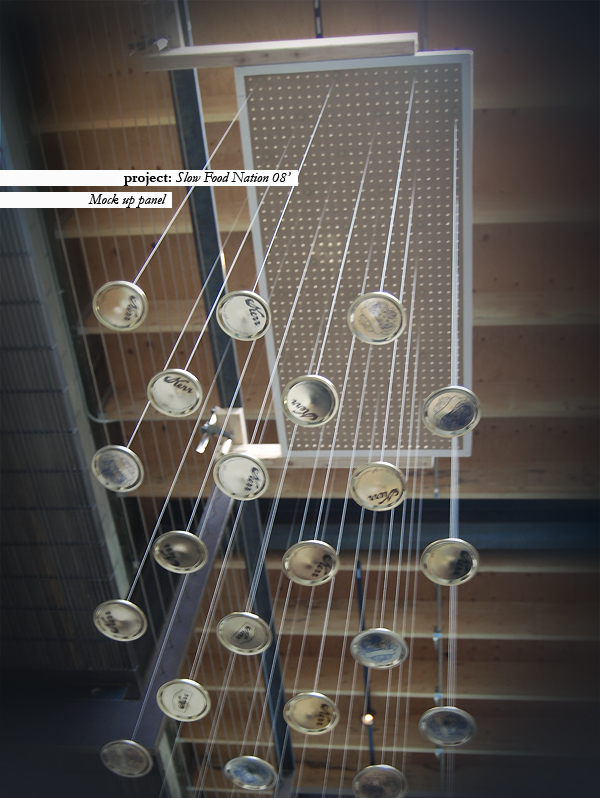
Suspended Ceiling using Grasshopper and Rhinoscript
I finally finished the script for the exhibition space we have designed where we suspend 3024 mason jar lids from a T-bar ceiling. In order to streamline the process, I used the Grasshopper plug-in to parametrically control several aspects of the design. Below, I try to explain each step of the process and how the script works. This script is much more detailed than the previous version, as now all of the steps are embedded into 2 scripts: one grasshopper definition which deals with all of the math behind the project, and one rhinoscript that deals with exporting the data to Microsoft Excel for easy access.
The files you will need to create the suspended ceiling are as follows:
New Update: I have modified the source files to be consistent with the release of the Grasshopper plugin on 10.10.2008. You can download all of the source files for the suspended ceiling here.
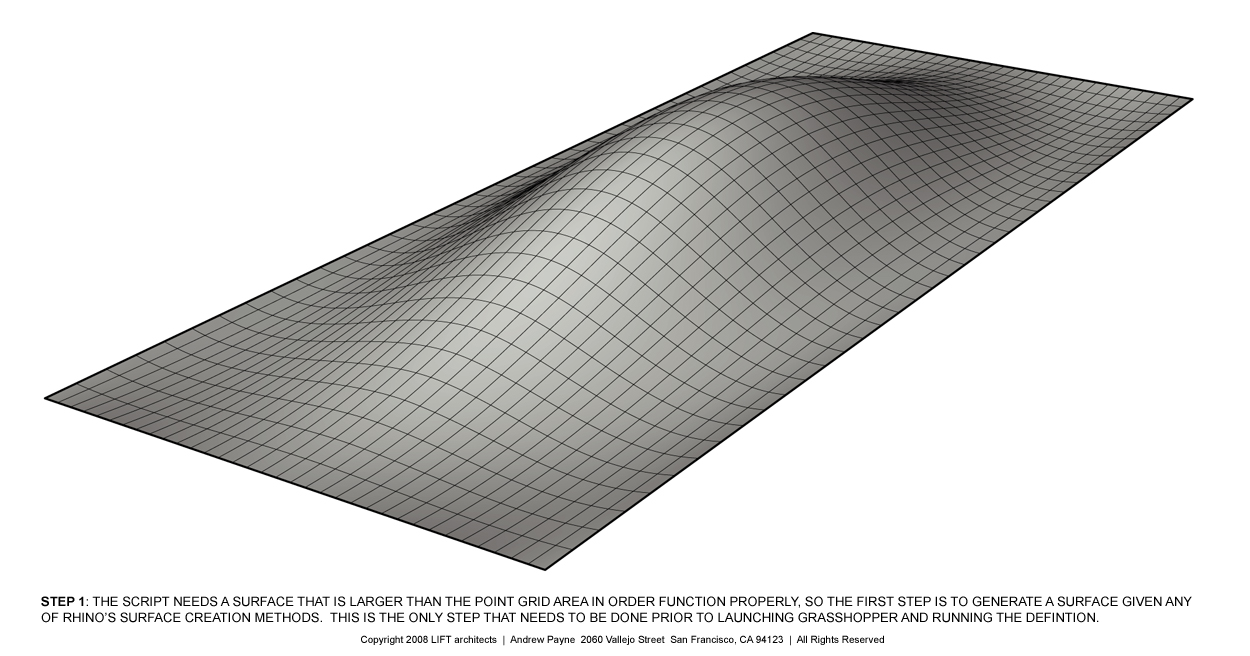 Step 1: The script needs a surface that is larger than the point grid area in order to function properly, so the first step is to generate a sufrace using any of Rhino's surface creation methods. This is the only step that is required prior to launching Grasshopper and running the definition. Click image for more detail.
 Step 2: The first part of the definition creates a staggered point grid based on a variable offset distance (inches) which is parametrically driven by an integer slider labeled "point spacing". It is important that the point grid is created above the surface (z-axis). Click image for more detail.
 Step 3: The next part of the definition duplicates the staggered point grid created in Step 2 and moves them along the z-axis so that the copies are below the given surface. Next, a vertical line is created between the original point grid and the duplicates. Click image for more detail.
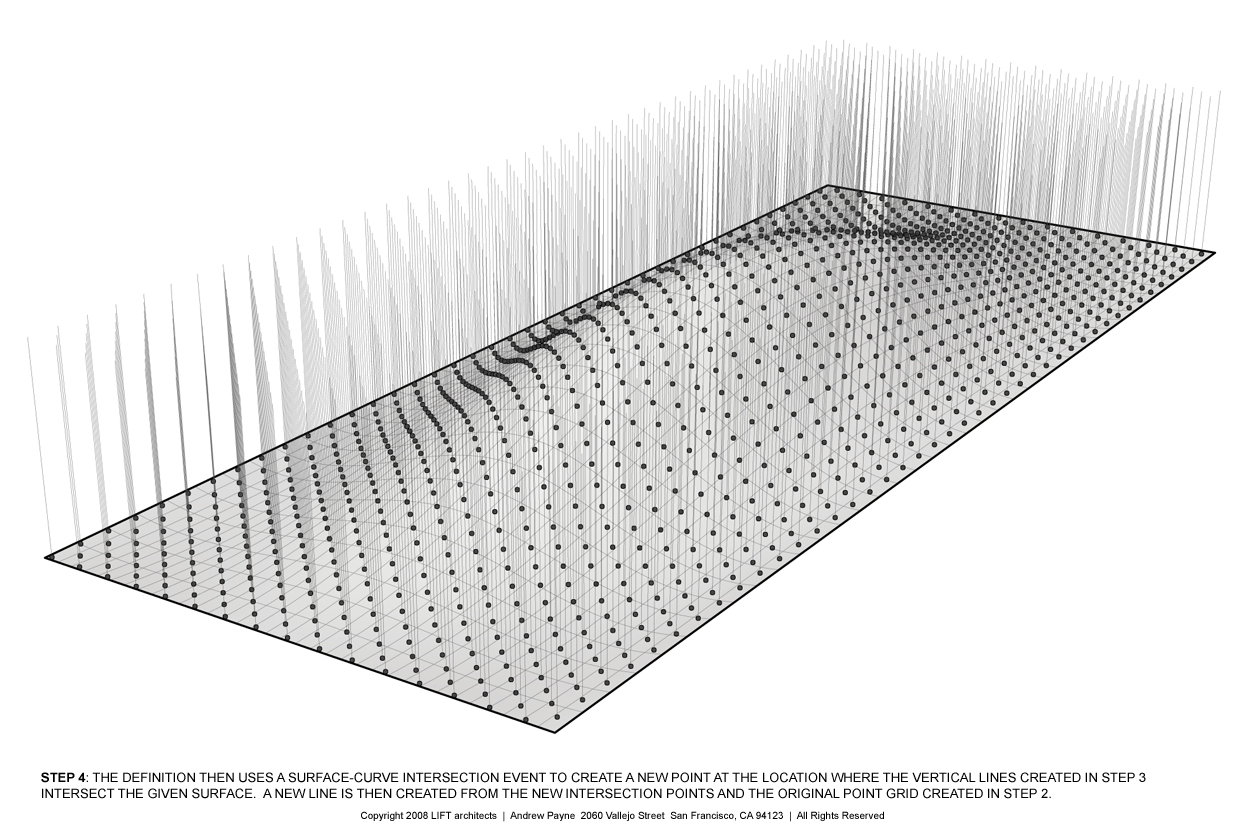 Step 4: The definition uses a surface-curve intersection event to create a new point at the location where the vertical lines created in Step 3 intersect the surface. A new line is then created from the new intersection points and the original point grid created in Step 2. Click image for more detail.
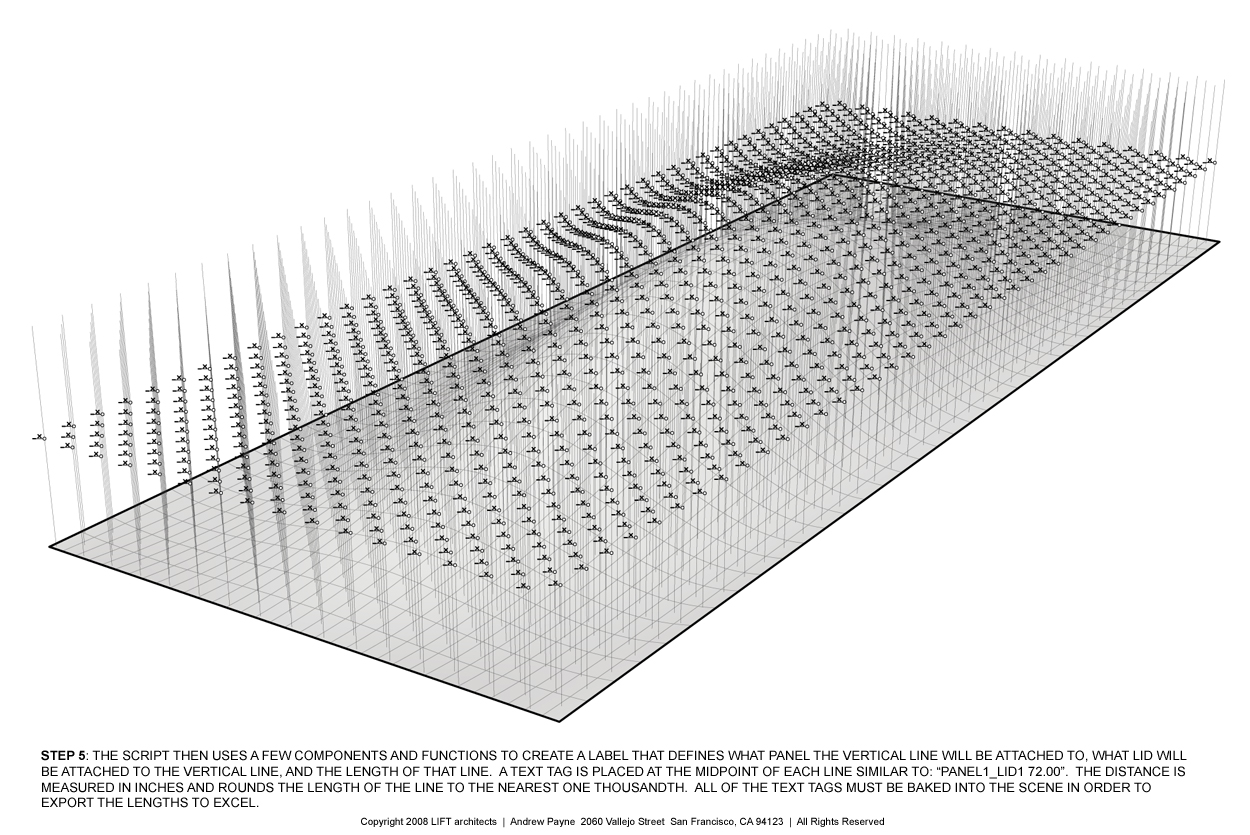 Step 5: The script then uses a few components and functions to create a label that defines what panel the vertical line will be attached to, what lid will be attached to the vertical line, and the length of each line. A text tag is placed at the midpoint of each line similar to: "Panel1_Lid1 72.000". The distance is measured in inches and rounds the length of the line to the nearest one thousandth. All text tags must be baked into the scene in order to export the data to excel. (special thanks to Troy Zezula for collaborating on this part of the script). Click image for more detail.
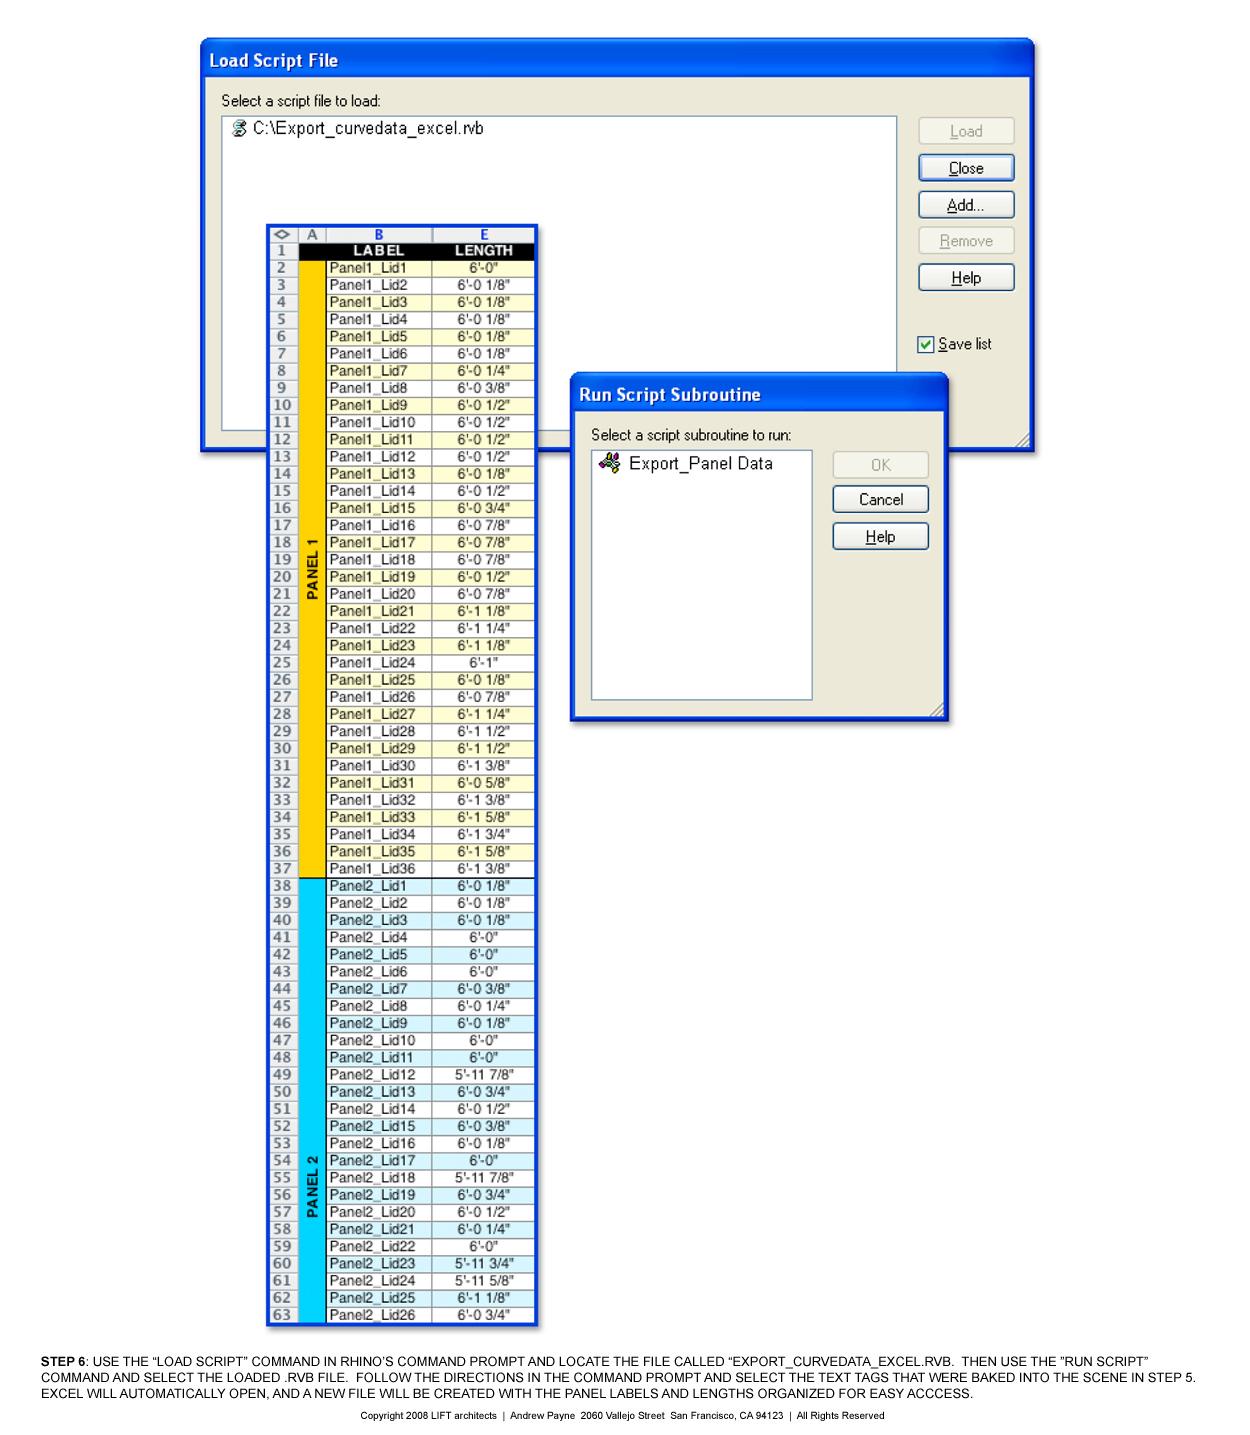 Step 6: Once all of the text tags have been baked into the scene, use the "Load Script" command and locate the rhinoscript called "Export_curvedata_excel.rvb". The use the "Run Script" command and select the loaded rhinoscript from the menu. Follow the on screen directions in the command prompt and select all of the text tags. Excel will automatically open, and a new file will be created with the panel labels and lengths organized for easy access. Within Excel you can convert the length stored from Rhino (rounded to the nearest one thousandth) into a more managable dimension using feet and inches and a specified tolerance. Click image for more detail.
"Put a Lid on It" Party
With a turn out of 21 people for our fourth "Put a Lid on It" volunteer party, we were able to get a great deal accomplished. It has really been an amazing process with an unbelievable response from the community. We've now completed 29 out of 84 panels (over 1,000 lids finished) for the mason jar lid ceiling. If you're interested in taking part in our exhibition pavilion for the Slow Food Nation event being held in Fort Mason on Labor Day weekend, please stop by our office any Thursday evening (6:30-9:00) or Sunday evening (4:00-7:00) between now and the event date. Thanks again for all those who have contributed so far to make the Pickle Pavilion become a reality! Below are a few miscellaneous pictures from the whole fabrication process.


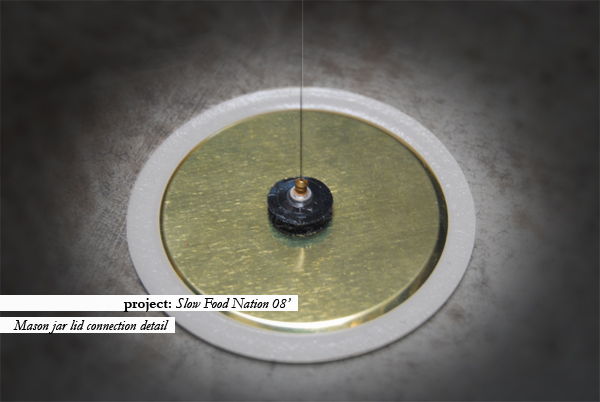
Lid of Lids Mockup
Our team finally decided to go forth with our second full scale mockup of the suspended mason jar ceiling and here are a few shots from this weekend's test. I was pretty satisfied with our connection detail between the mason jar lid and the fishing line that we are using to suspended the lid from the peg board ceiling. We were able to come up with a system that eliminates all knot tying by threading the fishing line through the back of an ear ring and sandwiching it between the ear ring back and the back side of one piece of a circular velcro strip. It did take a little practice, but overall the system seems to work pretty efficiently. The velcro also allows for some adjustability which will hopefully work in our favor once we begin final assembly.